
1. Give five examples of data that you can collect from your day-to-day life.
Ans:
Here are five examples of data that can be collected from daily life:
The number of students present in the class each day.
The number of fans or lights in different rooms of your school.
Monthly electricity bills of your house over the past two years.
Election results reported on television or in newspapers.
Literacy rate figures obtained from an educational survey or official reports.
2. Classify the data in Q.1 above as primary or secondary data.
Solution:
Primary Data:
When the investigator collects the information directly with a specific objective in mind, it is called primary data.
Examples:
(i) The number of students in our class.
(ii) The number of fans in our school.
(iii) Electricity bills of our house for the last two years
Secondary Data:
When the information is obtained from an existing source where it has already been collected and stored, it is called secondary data.
Examples:
(iv) Election results obtained from television or newspapers.
(v) Literacy rate figures obtained from an Educational Survey.
3. The blood groups of 30 students of Class VIII are recorded as follows.
A, B, O, O, AB, O, A, O, B, A, O, B, A, O, O,
A, AB, O, A, A, O, O, AB, B, A, O, B, A, B, O.
Represent this data in the form of a frequency distribution table. Which is the most common, and which is the rarest, blood group among these students?
Solution:
Frequency is the number of students having the same blood group. The frequency is represented in the table or the frequency distribution table.
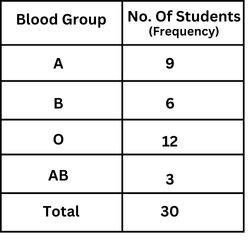
The most common Blood Group is the blood group with the highest frequency: O
The rarest Blood Group is the blood group with the lowest frequency: AB